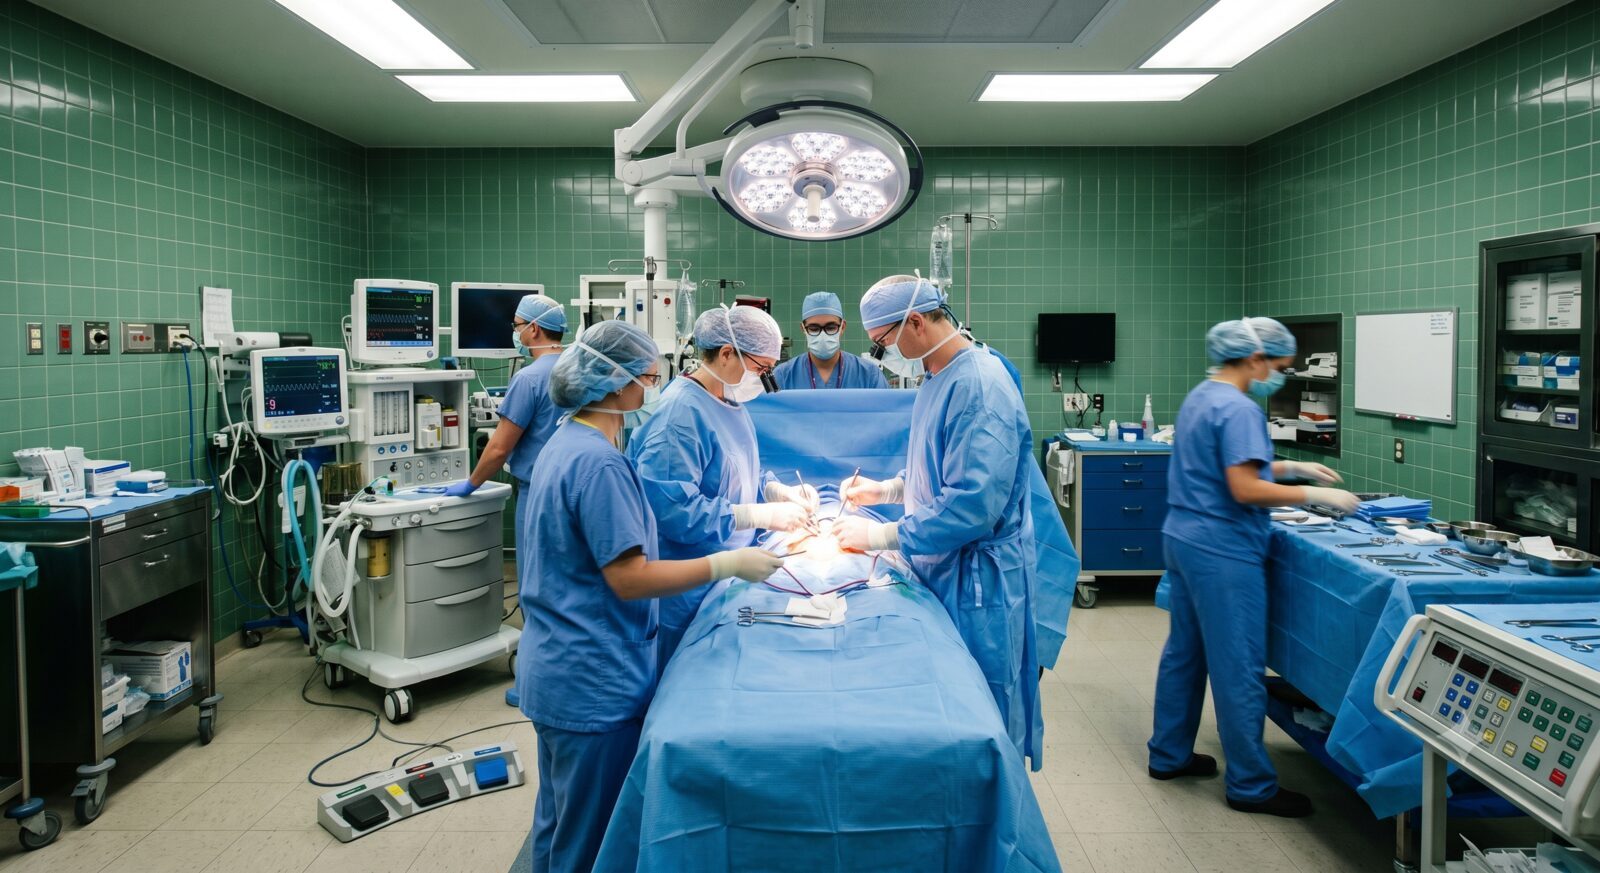
Operating room

The operating room is where time is most expensive.

angel brings flow intelligence to the surgical suite — measuring utilization, turnover and delays so the team can recover theatre time. It measures the system, not the surgery, and never records the operation.

Operating room (illustrative)
Illustrative — angel measures flow, never the procedure.
Surgical capacity calculator

Find the hidden capacity inside your operating rooms.

Enter a few numbers about your ORs. This tool estimates the operating-room time you could recover — and the cases and value it represents — without adding rooms, staff or hours. Every default comes from published research and is yours to adjust.

Your ORs

Approximate values are fine. Outlier entries are capped to sane ranges.

Benchmark: median ≈ 28.5 min; under 25 min is high-performing, over 40 min is poor.3

Most US health systems run 65–75%; the efficiency benchmark is 75–80%.4

Assumptions & currency — edit these to match your hospital

Lean interventions have cut turnover ~20% in published studies; 15% is a conservative default.5

Share of currently-idle prime-time recovered. Studies report ~23% of OR time idle on average; this captures a fraction of it.6

Default per case = OR cost/min × case length, as a proxy floor. The figure is set from the selected country's published OR cost (see Sources). Replace with your own contribution margin per case.

Estimates are illustrative and based entirely on the inputs above and published benchmarks. They are not a guarantee, and not angel's own customer outcomes. Your results may vary.

Your potential impact

Based on your inputs — the opportunity to increase surgical access without adding rooms, staff or hours.

7.3%
potential increase in annual case volume
1,092
added cases per year
$4.9M
estimated value of recovered time per year
164k
recoverable OR minutes per year

Where the opportunity comes from

Faster, more consistent turnovers 67,500 min
Recovered idle / white-space time 96,429 min

See how this could work at your hospital.

Request a demo
What we measure

Who enters, when, and where time is lost.

  • On-time start of the first case, and turnover time between cases
  • Actual case duration versus scheduled
  • Idle time, room traffic and scrub timing
  • The choreography of the room, by zone and role — not individual surveillance
How it works

Measures the system, without recording the surgery.

01

Wide-angle view

A camera with a wide view of the room, with the surgical-table area masked.

02

Derived data only

Extracts movement and events — skeletons, timings — and does not record the operation.

03

Anonymized storage

Stores only anonymized data, with access restricted to a hospital committee.

04

For management, not judgment

Supports operational decisions. It measures the system, never an individual.

The opportunity

A quarter to a third of theatre time is lost.

~60%

average operating-room utilization reported in the OR-management literature, against a 75–85% efficient target.

Proven

a category already real abroad — ambient OR intelligence is in use across hundreds of rooms internationally.

HIPAA-ready

built for local compliance, with on-site processing and anonymized, committee-restricted data.

Third-party results are cited as market validation, not as angel's own outcomes.

How this is calculated

No black box. Here is the math.

  1. Base volume = ORs × cases per room per day × working days per year.
  2. Time in use = base cases × (case length + turnover). Available prime-time is implied by your utilization (used time ÷ utilization), and the rest is idle.
  3. Recoverable minutes = (turnover minutes × turnover-reduction %) + (idle minutes × idle-recovery %).
  4. Added cases = recoverable minutes ÷ (case length + turnover). The % increase is added cases ÷ base cases.
  5. Value = added cases × your value per case.

Everything is driven by the numbers you enter. The two recovery levers (turnover, idle) are set to conservative, literature-anchored defaults and can be changed at any time.

Sources

  1. Childers CP, Maggard-Gibbons M. Understanding Costs of Care in the Operating Room. JAMA Surgery. 2018;153(4):e176233. Mean OR cost ≈ $37.45/min (inpatient), $36.14/min (ambulatory). jamanetwork.com
  2. Smith T, et al. The Cost of OR Time is $46.04 per Minute. Journal of Orthopaedic Business. 2022;2(4):10–13. Mean of 14 published estimates: $46.04 ± $32.31/min. jorthobusiness.org
  3. OR turnover-time benchmarking literature: median ≈ 28.5 min; <25 min high-performing, >40 min poor. Optimizing OR Efficiency, 2024 (PMC11732218)
  4. OR utilization benchmark 75–80%; most US systems run 65–75%. Surgical Directions; Impact Advisors
  5. Reductions in turnover time of ~20% via Lean interventions. Annals of Thoracic Surgery, 2019
  6. First-case delays affect 51–61% of first cases; ~23% of OR time idle on average (up to 62% in some hospitals). Am J Surgery 2019 (PMID 31582177)

Per-country OR cost (value-per-case default)

  1. USA — ≈ $47.99/min (2023 USD), inflation-adjusted from Childers & Maggard-Gibbons ($37.45/min, JAMA Surgery 2018). PMC11531768 · JAMA
  2. Brazil — ≈ R$783/OR-hour (÷60 ≈ R$13/min). Planisa KPIH hospital benchmark, 2021. Industry benchmark (secondary); verify locally. medicinasa.com.br
  3. Portugal — ≈ €977.50/OR-hour for Group-C hospitals (÷60 ≈ €16/min); 2015 official audit. Secondary & dated; verify locally. Público
  4. Isle of Man — no native figure exists; UK staff-cost proxy £9.77/min (St Mary's, London, 2015). Staff cost only — understates total OR cost. PMC4796663
  5. Ireland — no Ireland-specific published OR-cost figure found; enter your own value per case.

Recover the time the schedule can't see.